Data Source: The data used for this analysis was sourced from Kaggle.
Cleaning The Dataset
The following steps were taken to clean and analyze the data:
- Each column was formatted in the proper format.
- Duplicates events ID was checked for and removed
- Columns not needed for the analysis were removed
- The blank cells were filled using the find and replace option in the Home tab.
- Under the Investigation Column, the blank cells were replaced with Unknown. The same thing was applied to Airport Name, Aircraft Damage, Aircraft category, Amateur Build, FAR description, and Purpose of Flight columns respectively.
- The blank cells under Total fatal injuries, Total serious injuries, Total minor injuries, and Total uninjured columns were replaced with 0.
- Under the weather column the blank cells were replaced with NA.
- Some information was not indicated in the dataset and was replaced with unknown.
Analysis
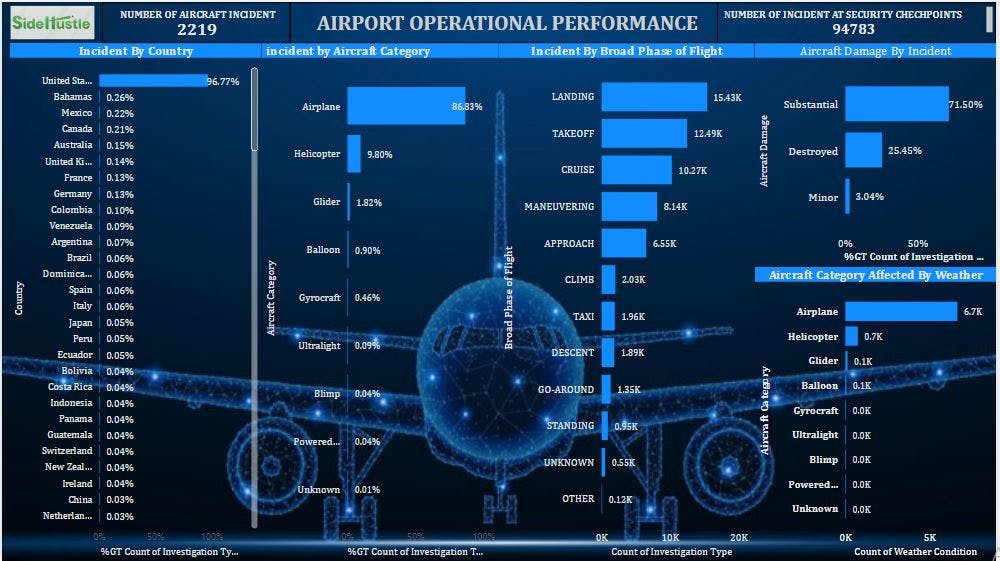
An “incident” is any unexpected event that does not result in serious losses or injury; an “accident” is an unexpected event that causes damage, injury, or harm. From the dataset, there was a total of 61,694 reported cases of accident, 2,219 cases of the incident and 87,046 unknown investigation types.
- A bar graph was used to show the count of Investigation types and we can see that accidents had the highest with a total of 61,694, the incident had a total of 2,219 and unknowns had 8,7046.
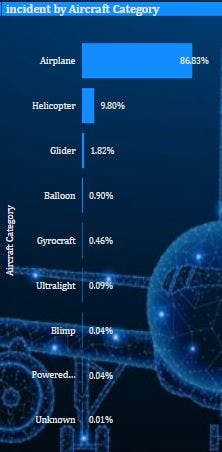
- From this analysis, we looked at the type of aircraft that was mostly involved in accidents/incidents, by filtering with investigation type. From the graph, we can see that aeroplanes had the highest number in all categories with 86%.
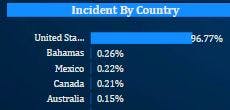
- Using the pivot table, we discovered that the USA had the high count of air accidents with 96.77%
Here we visualized the number of various types of injuries based on the aircraft categories and we can see that Airplane had the highest number under the various type of injuries, followed by helicopters.
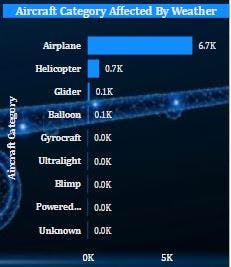
Here we visualize the type of aircraft that was affected mostly by weather. We can see that aeroplane was affected mostly under the various weather conditions followed by a helicopter.
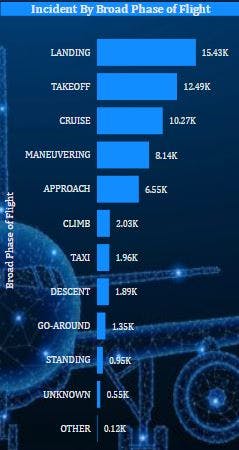
- From this analysis we can see that most of the accidents and incidents happened during the landing Stage, followed by the takeoff stage. This visual was filtered using a type of investigation.
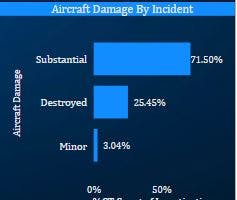
- Damages by the incident were discovered to be 71.5% substantial, 24.45% destroyed and 3.04% as minor
- Number of incidents at security checkpoints: The total number of incidents at security checkpoints was estimated to be 94,783.
Dashboard