Insight Analysis of Cholera and Malaria in Nigeria
Project(2) by data analytics team 4 of SidehustleNG Cohort 5.0 Bootcamp
Introduction
It's week two of our Bootcamp(yeah!). This week we were assigned a task to work on any two Health/Disease Insight analyses of our choice. The task focuses on analyzing the health dataset, we selected Cholera and began the lengthy process of scraping, cleaning, analyzing and visualizing the data.
Scrapping the Data
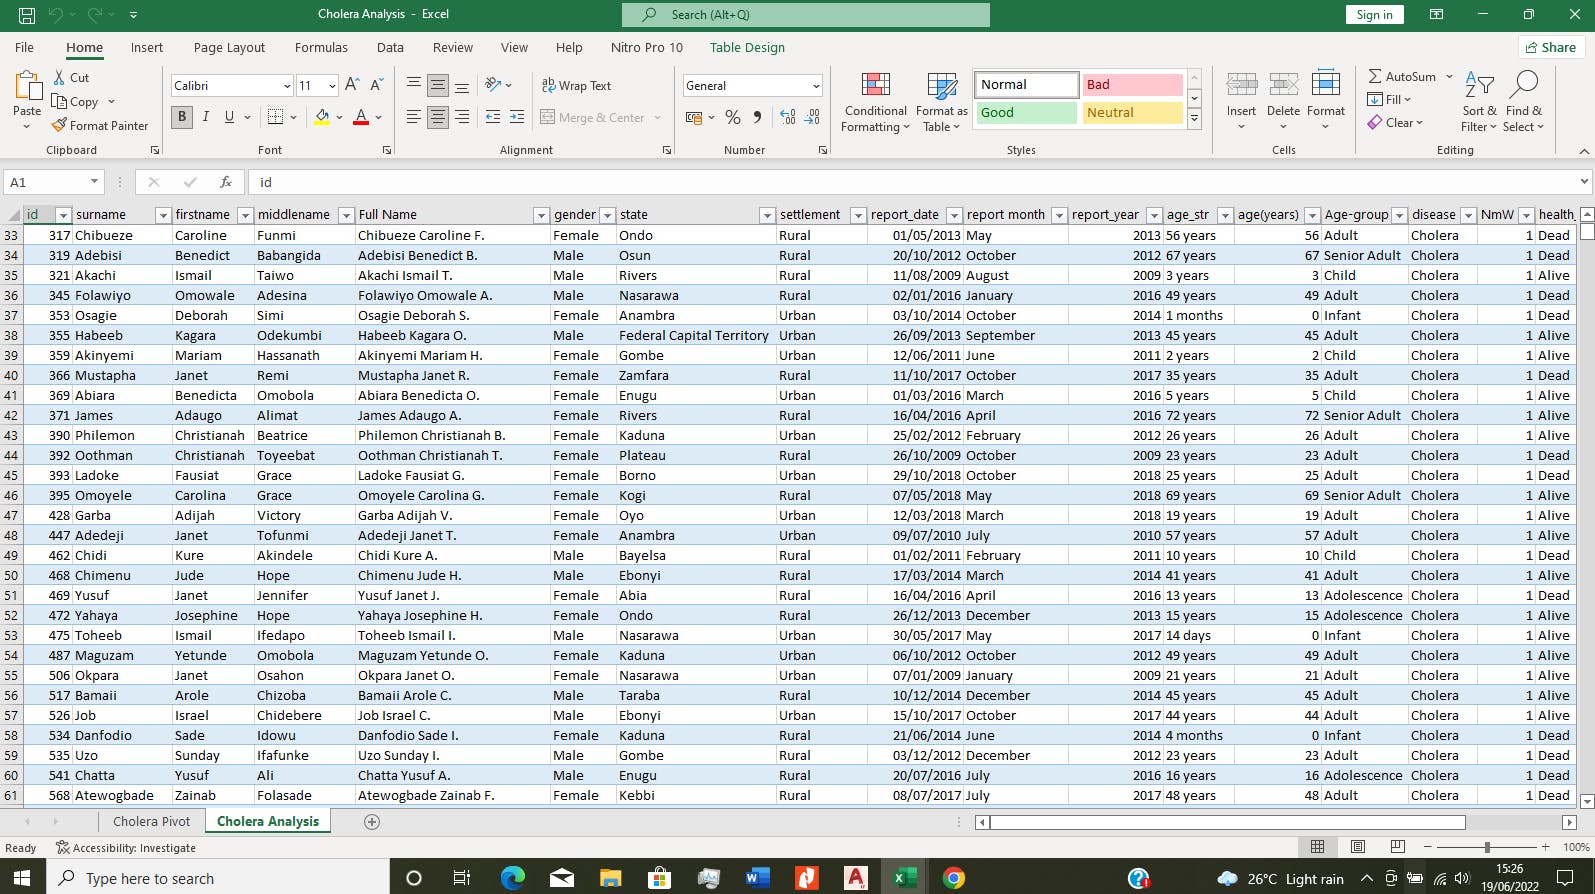
From week one's experience, we knew scrapping data would be quite challenging so we launched project "Everybody Go and Look For Dataset". After a fruitless search for a live dataset, we decided to use existing data which we got from https://www.kaggle.com. This dataset includes common disease outbreaks in Nigeria from 2009 to 2018 and contains about 39 columns and 280,000 rows of data. Here is the link to the file:https://www.kaggle.com/datasets/eiodelami/disease-ourbreaks-in-Nigeria-datasets.
Cleaning the Data
Cleaning up your data is very vital because it helps to prevent errors in your analysis, avoid data duplication, etc. In this step, we did the following:
- We filtered the dataset to show data for just cholera and malaria disease
- Dropped redundant columns
- Created a new column showing the age by years
- Created a new column to group the age into 5 categories: • Infant: 59 years old
- Joined the surname, first name and last name column to form the full name column which shows the full names of all our cases.
- Created a new column to show the month the case was reported
- Replaced cells with no report date entry with N/A
Malaria Analysis
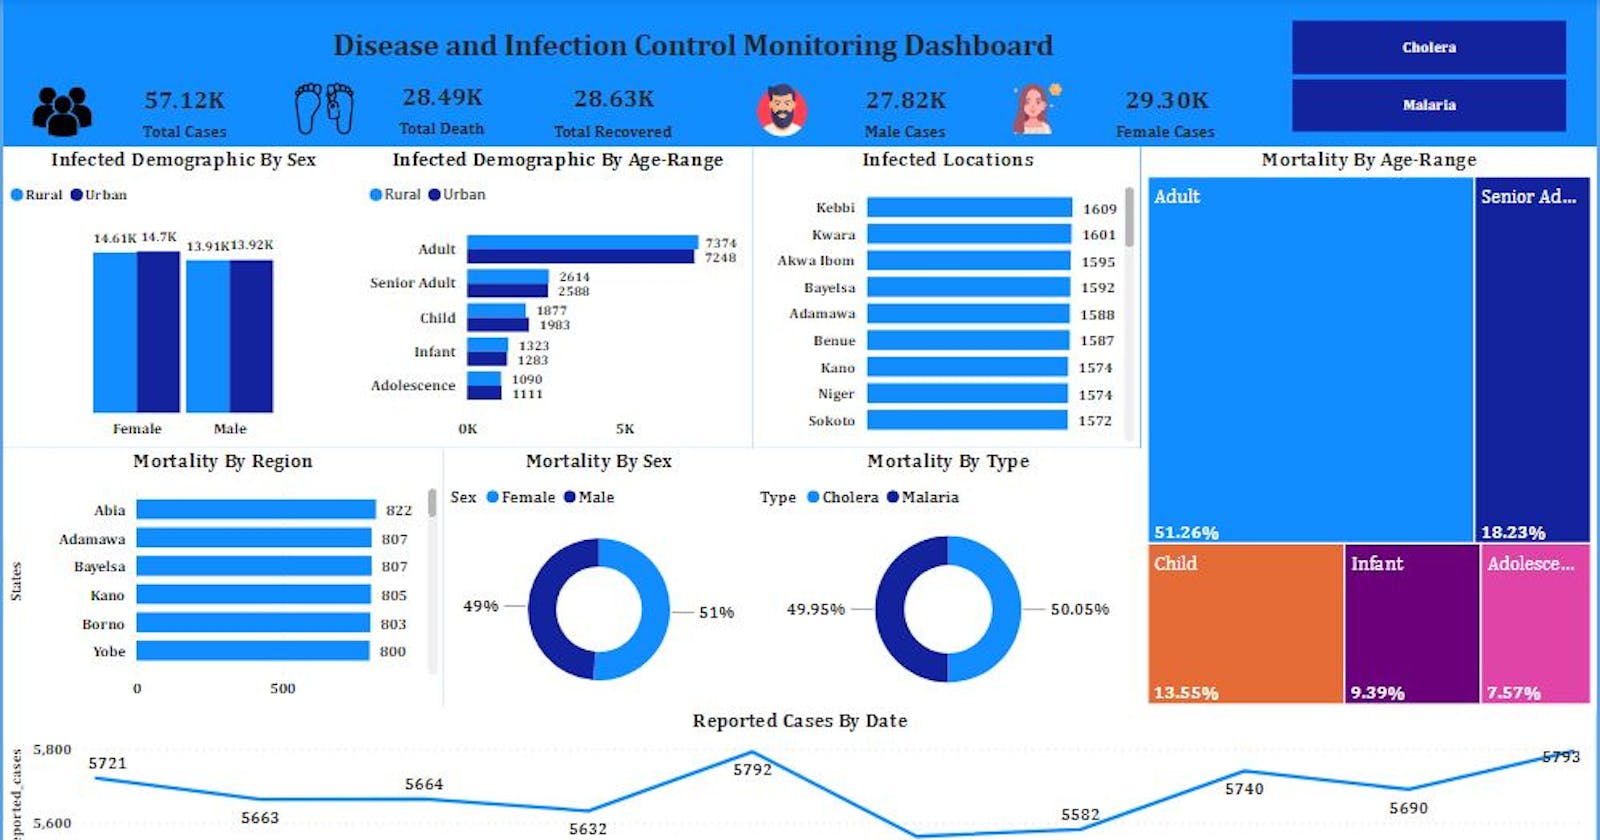
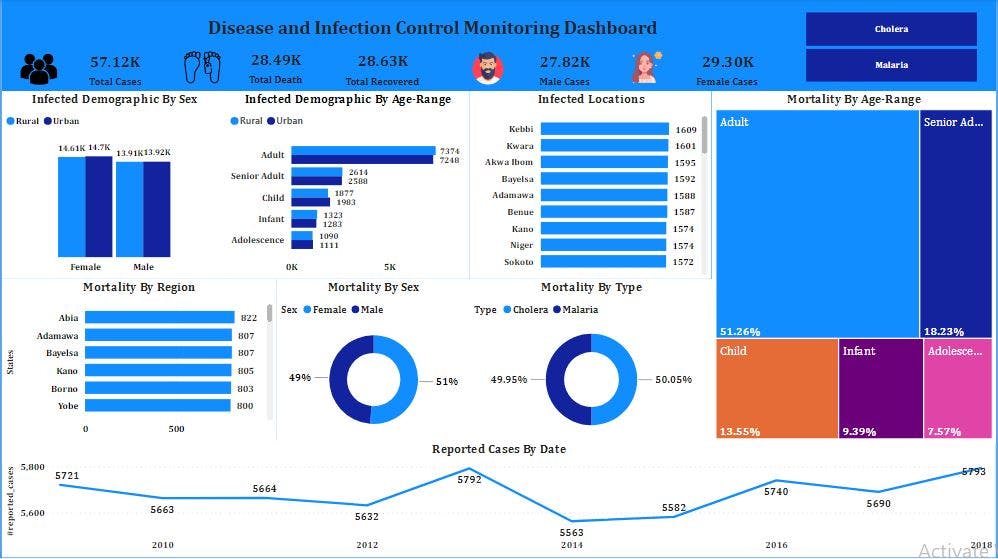
From the dataset, there was a total of 28,535 reported cases of Malaria infection from 2009 to 2017 Infected demographics by sex – We used a pivot table to analyze the number of people living in rural and urban settlements by counting the number of infected persons based on gender in this settlement. From the analysis, the population of the rural and urban settlements are 14,204 and 14,331 respectively. Going by this analysis, it can be seen that malaria affected more females living in both settlements.
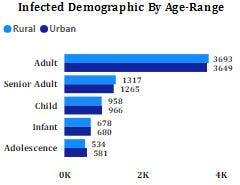
Infected Demographics by Age Range – We used a pivot table to analyze the number of people in the different age range that was reported to have Malaria and compared the values for both urban and rural settlements. In both demographies, it is seen that Adults (i.e. within the age range of 19-59) were mostly affected by Malaria and Adolescence (13 – 18 years old) were the least affected by Malaria in both settlements.
Reported Cases by Date – Analysis of a line chart of the number of cases per month for every year shows that the rate of reported cases is not affected by the time of the year, although several cases are seen to have peaked in the year 2010.
Affected Locations by Heat Map: From the map visual, most of the reported cases were from Kano, Kwara and Ebonyi. While Plateau state had the least reported cases.
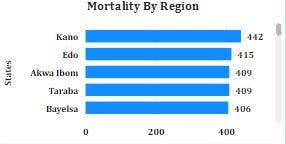
Mortality By Region: From the analysis, we can see that Kano state has the highest mortality rate by region (which is known to be among the state with the highest reported cases) and Plateau state has the lowest mortality rate by region and is also known to have the least reported cases.
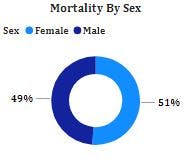
Mortality by Sex: The mortality rate generally in the whole data set was high among the female gender. Also, for Analysis 8
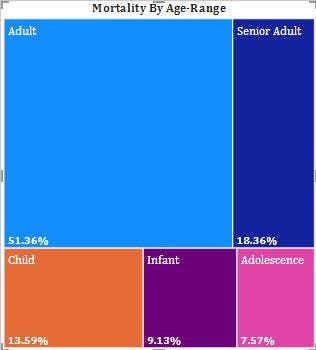
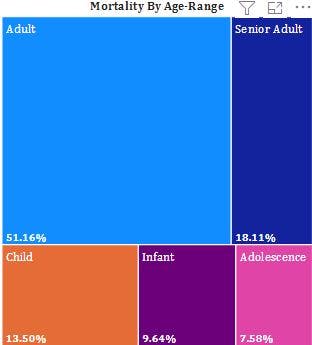
Mortality by Age_Group: The rate at which malaria led to the death of the people based on their age group occurred more among adults and less in Adolescence.
Total death: Using the settlement to analyze the total death, it can be seen that the death was more in the rural area compared to the urban area. This can be due to poor health care services.
Cholera Analysis
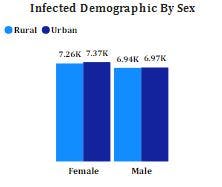
From the dataset, there was a total of 28,589 reported cases of Cholera infection from 2009 to 2018 Infected demographics by sex – I used a pivot table to analyze the number of male and female cases living in rural and urban settlements by showing counting the number of male and female cases and adding settlement as a filter. From the analysis it was discovered that there was a total of 14,673 female cases - 7,342 from individuals in rural settlements and 7,331 from urban settlements and 13,916 male cases – 6,965 from individuals in rural settlements and 6,951 from urban settlements. It is seen that irrespective of the demography of the individual, from our analysis, cholera shows to affect women more.
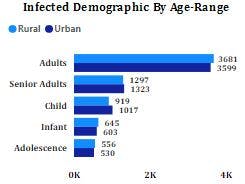
Infected Demographics by Age Range – I used a pivot table to analyze the number of people in the different age range that was reported to have Cholera and compared the values for both urban and rural settlements. In both demographies, it is seen that Adults (i.e within the age range of 18-59) were mostly affected by Cholera and Adolescence (13 – 18 years old) were the least affected.
Reported Cases By Date – Analysis of a line chart of the number of cases per month for every year shows that the rate of reported cases is not affected by the time of the year or season although several cases are seen to have peaked in the year 2011.
Affected Locations by Heat Map - Most of the reported cases were from Borno, Benue, Kebbi, Imo and Adamawa states with Taraba, Ogun, Federal Capital Territory, Ebonyi, and Ekiti states having the least reported cases.
Mortality by Sex – From analysis 7,356 of the 14,673 infected females died of the disease and 6,965 of the 13,916 infected males died of the disease, this shows that over half of both genders that were infected by cholera lost died as a result.
Mortality by Age Range – Adolescence recorded the highest mortality rate with 51.45% of the total reported case reported dead while infants have the least amount of mortality 49.27% dying from the infection.
Mortality by Rate – Analysis of the data showed that 50.09% of the reported case were reported to not have recovered and lost their lives as a result of the disease.
Total Death – a total of 14,321 death was recorded.
