Sales Analysis of Office Supplies Sold To Customers In Nigeria By Global Store
A project by the data analytics team 4 of SidehustleNG Cohort 5.0 Bootcamp


Introduction
This is the first publication as members of the SideHustleNG Cohort-5 Data Analytics Track Portfolio Bootcamp Team 4 (I know that’s a rather long name) but for short we have named our team’s blog - SideHustleNg Cohort 5 Data Analytics T4 (get familiar!). This week we were assigned a task to carry out a sales analysis on a product from Nigeria or consumed by Nigerians, the task was specifically targeted at improving our ability to scrape, clean and visualize data.
Scrapping The Data
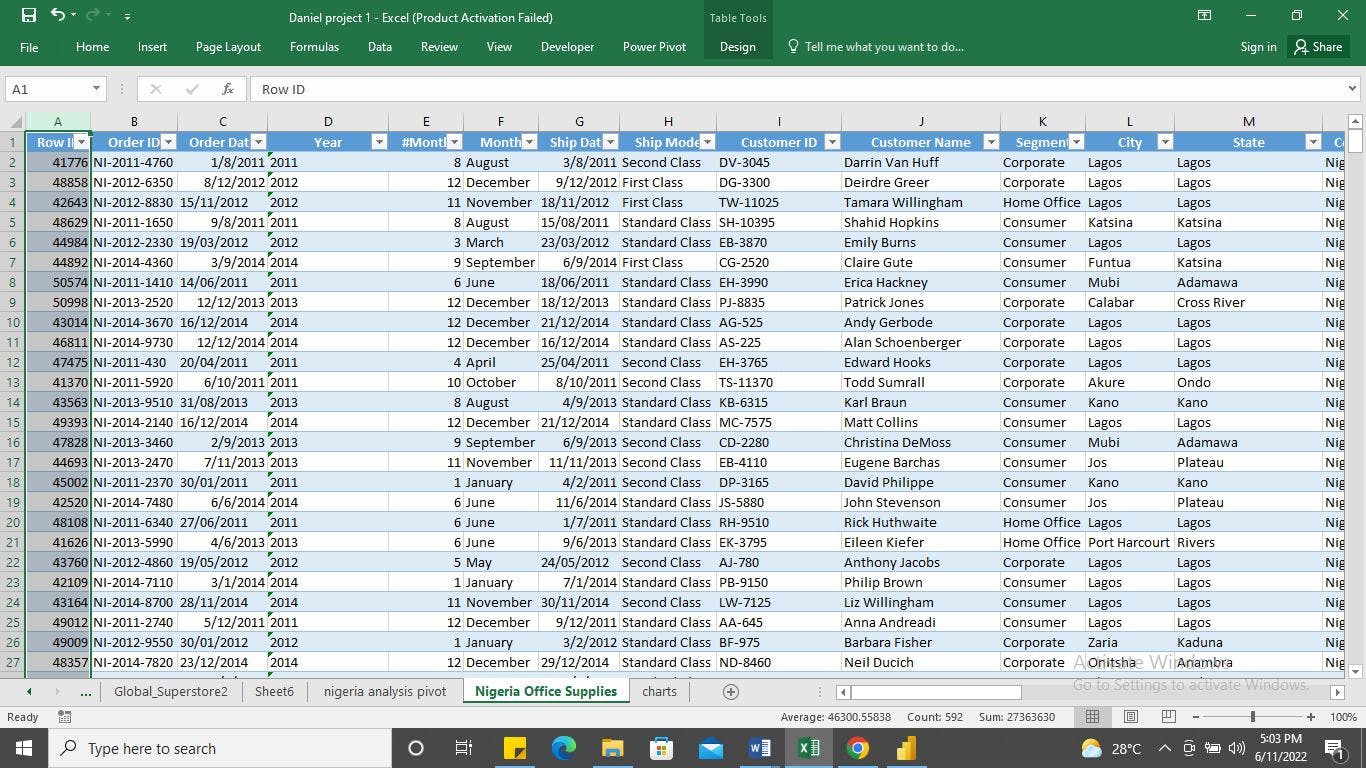
Scrapping data was a rather daunting task than was initially expected, after a long process we found a dataset on Kaggle containing sales data for a Global Superstore, the dataset consisted of 24 columns and 51,291 rows containing details of sales from 2011 to 2014.
We filtered the dataset to focus our analysis on sales of products in the office supplies category to customers in Nigeria which reduced the number of rows to 591.
Cleaning The Data
We started our analysis by first uploading the CSV file into Excel which was used to clean and analyze the data. To clean the dataset we checked for blank cells, and duplicate entries and corrected the data format for each column of the dataset, using Excel spreadsheets functions, 3 new columns were created;
Year – contains the year the order was made
Month ¬– the month order was made
Unit Price – the price of each product gotten by dividing sales by quantity.
Analysis
Taking a step back to look at the bigger picture of the data we are analyzing we discovered using the pivot table function that customer’s from Nigeria constituted 1.76% of the total global sales from 2011 to 2014 which was **905 **of the 51,290 sales across all countries covered by the dataset. Sales of products in the office supplies category to Nigerian customers were 591 of the 905 total sales constituting 65.3% of the total sales and hence the products from this category were the most purchased products in Nigeria within the period, after which we took a more in-depth survey of our dataset and summarized it as follows; from 2011-2014 there had been:
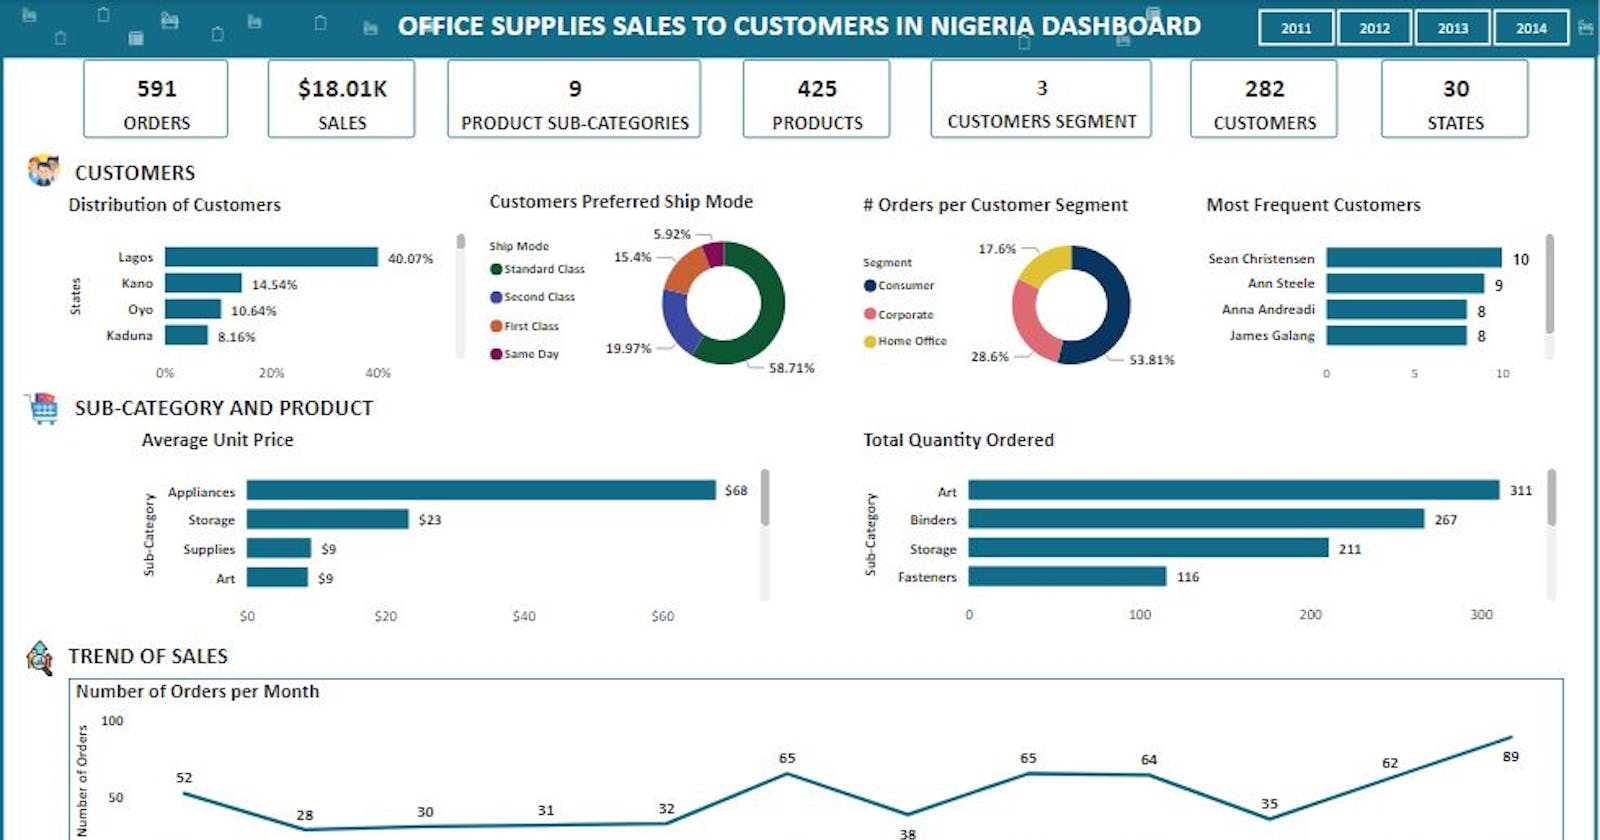
591 orders
$18,005.49 in total sales
9 products sub-categories
425 products sold
3 customers segment
282 different customers in 30 states across Nigeria.
Customers being the most important aspect of every business, we begin a general analysis of the dataset focusing on information about our customers. We started by creating a bar chart showing the distribution of our customers across states in Nigeria
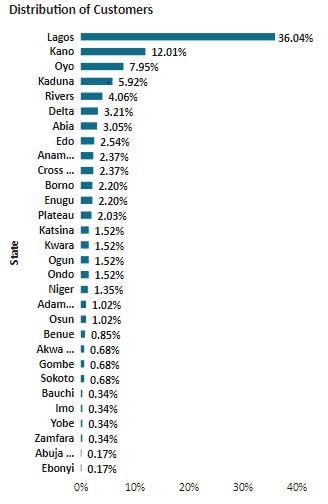
Lagos state was discovered to be a sales hotspot with 36.04% of the total orders coming from customers in Lagos, with Kano state and Oyo state ranking second and third with 12.01% and 7.95% respectively.
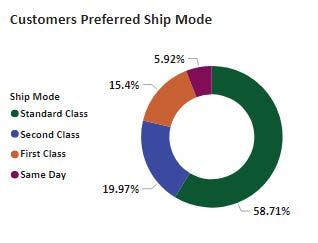
Using a pie chart to visualize the number of orders delivered with each shipping mode, the Standard class was seen to be the preferred shipping mode for our customers in Nigeria with fewer people opting for the Same day ship mode.
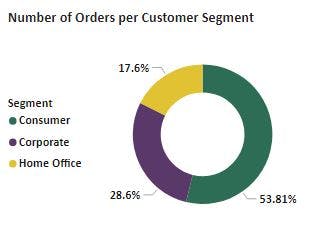
With our products being in the office supply category, you would think that our top customers would-be customers in the corporate or home office customer segment but after analysis of the data, it was discovered that over half of the total orders were from the regular Consumer segment with 54% of the total orders and customers in the Home office segment at the tail end with 18%.
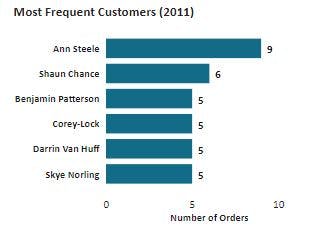
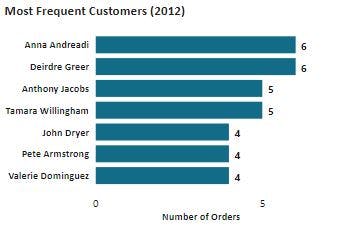
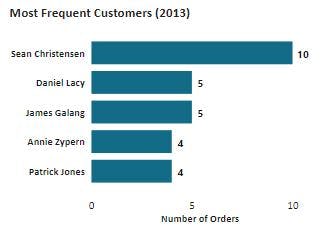
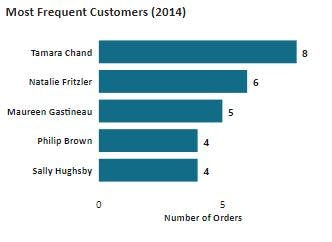
We concluded our customer-focused analysis by visualizing our most frequent customers for each year by creating a bar chart showing the total quantity of products ordered per customer and filtering it out to show only the top 5 customers, comparing the results across years, it is seen that for every year there was a different set of “top customers”, this, as well as the fluctuations in total customers each year, shows a "poor customer retention" problem.
Moving to the next important segment, which was analyzing the goods and services (products) we are offering to the consumers, we created 2 charts to compare the sub-category and products with the most orders to the most expensive sub-category and products in order to discover our most important product.
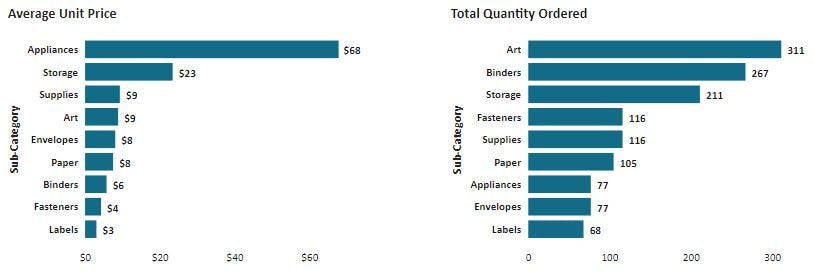
N.B "Drill-down" function has been enabled to compare the average unit price and total quantity ordered for each product by clicking the respective sub-category bar in the PowerBi dashboard.
Comparing the charts for the average unit price and total quantity ordered for each sub-category, the Storage sub-category appears to be our most important product sub-category, as it was the second most expensive sub-category of products and the third most ordered product sub-category. Products in the** Arts, Binders and Storage** sub-category were consistently the most purchased in 2011 – 2014 with a gradual increase of products in the** Fasteners** sub-category from 5.16% of the total quantity of products ordered in 2011 to 18.52% in 2014, being the** 3rd most ordered sub-category** that year.
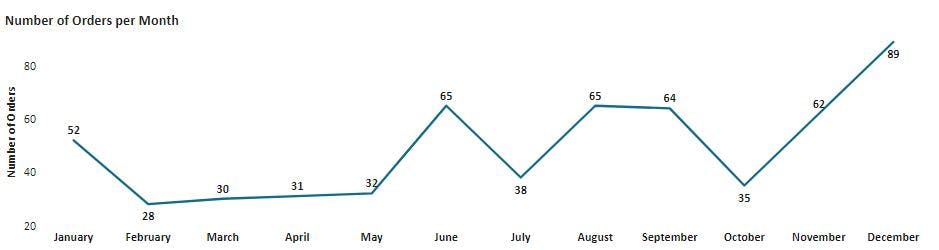
Analysis of the general performance of the store began with a trend of sales for each month which showed a slow and unsteady increase in the number of products ordered every year with an increase in the number of orders for office supplies as the end of the year approaches, possibly due to customers preparing for the New Year.
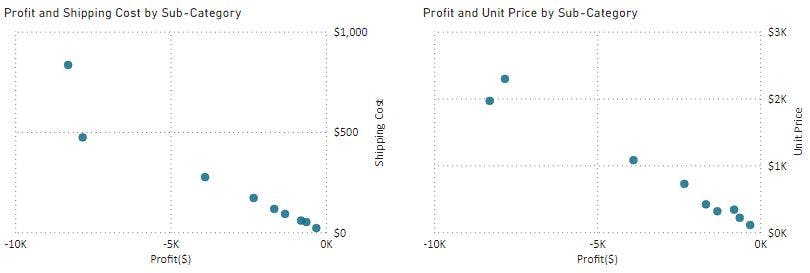
It was also observed that all products in the office supplies category sold to customers in Nigeria were sold at losses, further probing into the main dataset revealed that all products sold to customers in Nigeria were sold at losses. Naturally, this would arouse curiosity as to the reason why, so to solve this, we created a scatterplot chart comparing the Profit to both Unit Price and Shipping Cost and discovered a** negative correlation in both criteria i.e the profit reduced (losses increased) as the shipping fee and average category cost increased** although due to limited data, it’s not definitive to say if the reason for the losses is caused primarily by the amount spent on shipping the product to customers in Nigeria and/or if the products are too expensive and not profitable to be shipped to Nigeria but these are 2 major factors that should be looked into and addressed.
Visualization

All charts and the resulting dashboard were created using PowerBI.
Recommendations
Establishing an Office Supplies Warehouse in Lagos State - This is aimed at utilizing the large customer base in Lagos State and minimizing the cost of shipping products to Nigeria thereby reducing COGS which can potentially lead to an increase in the profit for each sale.
Creating Targeted Ads for States With Lower %Orders - the number of sales in states such as Ebonyi, Abuja, Zamfara, and Yobe can be improved by the creation and broadcasting of targeted ads that suit the needs of individuals in the geographical region.
Increased Customer Retention - The store should build a stronger relationship with the dedicated customer by offering discounts and sales to increase their customer retention and thereby increase the total number of orders per year.
Availability of Products in Storage Category - The store should ensure that storage products are always readily available for purchase and also take note of recent market trends as the need for Fasteners increases every year.
Adequate Staffing During the Last Quarter of The Year - The increase in the number of orders in the last quarter of each year should be taken into account and an adequate number of staff should be available for the timely processing of orders and also prevent staff from getting overwhelmed which could lead to a reduction in their productivity.